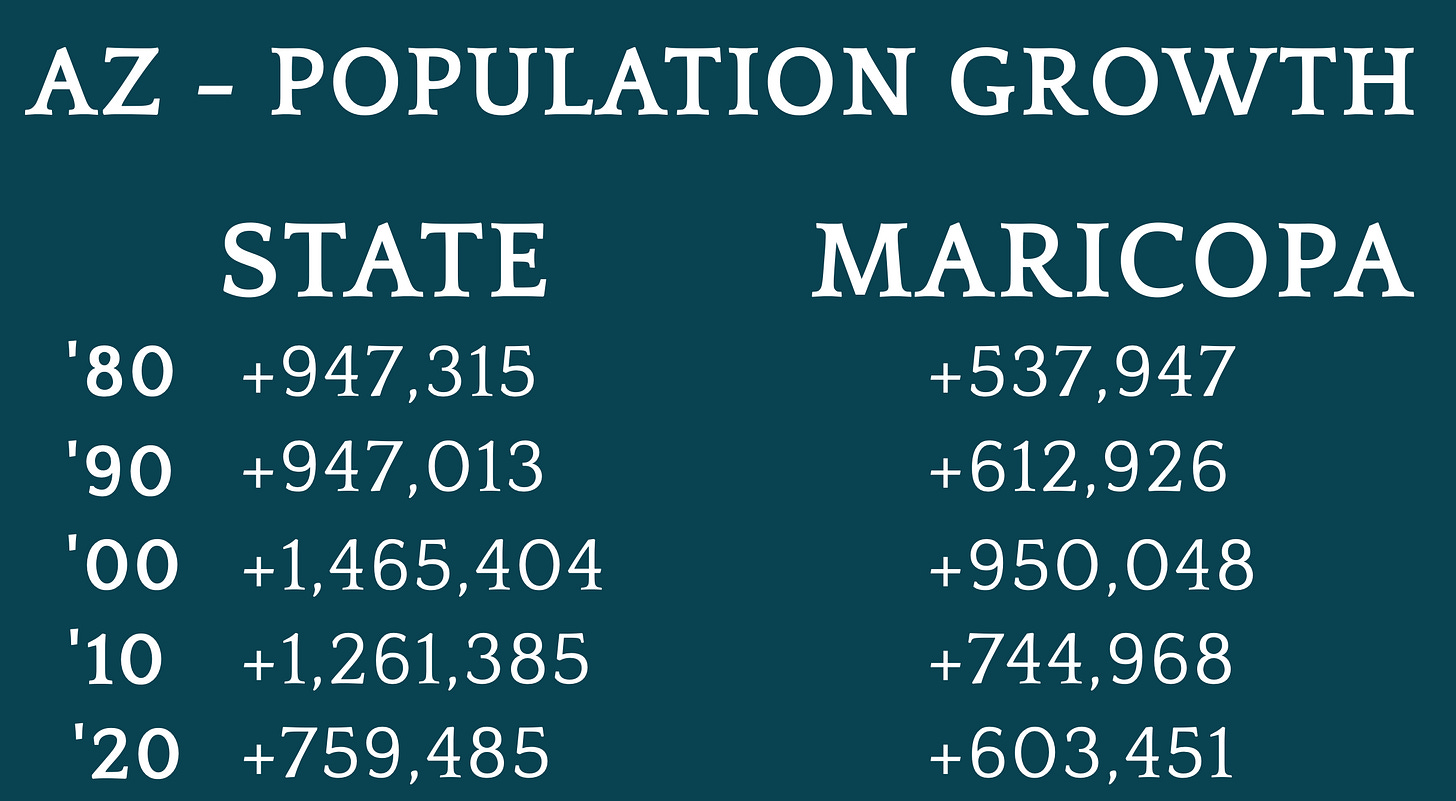
Arizona’s election picture takes a mysterious dive into the bowels of data reconciliation hell when considering its population trends over five decades. The state, and its largest county, Maricopa, has been soaring in population growth since the 1970s, but supposedly hit a brick wall in the 2010s, despite all firsthand accounts to the contrary. I revealed this right off the bat in my appearance before the Arizona Senate on February 23 (move to the 1 hour, 17 minute mark of the linked video).
Even with clear suppression, Trump’s certified electoral college slate from 2020 is now worth three more electoral votes than it was then, up to 235 electoral votes from 232. COVID-mania made it clear to everyone that blue state prisons were hemorrhaging population, and in fact, California lost net population, officially, in 2020 for the first time since 1900, and has done so in the two years since. Other lockdown-loving states lost citizens in droves, with many fleeing places like New York, New Jersey, Connecticut, Michigan, and Illinois.
This raises the question – just how widespread is the lie about our census numbers? Census numbers are critical to the electoral integrity of the nation, given that the Method of Equal Proportions uses them to derive the distribution of 538 nationwide electoral votes between the 50 states and Washington, D.C. All states, regardless of size, are allotted one elector per Senator (two electors), and one elector per representative, of which the smallest states have one, making the minimum electoral value of a state equal to three electors.
My Hypothesis
Reported population growth is being suppressed in Republican or Republican-trending states to limit electoral representation of an emerging America First populist coalition, and population loss is not accurately captured in Democrat states to limit or prevent loss of electoral representation in those states.
Showing the Work

The states pictured above have believable population totals reported in the 2020 census. They are in line with growth trends since the 1980s and reflect migration patterns attached to known regional population loss (such as Californians moving to Oregon or Washington), or economic decline (such as stagnation or population loss seen in Ohio and West Virginia, respectively). These estimates also take into consideration the Census Bureau’s own admission that many states are undercounted or overcounted in the 2020 census.
Note – Certain states experiencing population boom, such as Idaho or Montana, may still have inaccurate totals, but the published totals corroborate with known trends to the states, and in many cases, exceed the previous highs. Likewise, states like Pennsylvania reflect believable trend totals, but may still have losses minimized.
Continue Reading: https://skeshel.substack.com/p/inside-the-census-bureaus-corruption